
UK Poverty Statistics: What the Numbers Mean for Wallingford Households
The most recent uk poverty statistics describe roughly 14.3 million people living below the relative low-income line, a figure that has barely shifted in a decade. Anyone reading uk poverty statistics for the first time is usually surprised that around 4.3 million of those people are children, and that more than half of them live in a household where at least one adult works full time. Poverty in Britain is no longer a story about worklessness; it is a story about wages that stall while rent, energy and food climb. In a market town like Wallingford, where average house prices sit far above the South East median and bus routes thin out after early evening, those national averages land unevenly. This guide unpacks the headline figures, explains the thresholds behind them, and shows how the squeeze reshapes ordinary household decisions, right down to what families can afford to spend on a pet.
What the Latest UK Poverty Statistics Actually Measure
Poverty in Britain is measured against income, not against a fixed basket of goods. The relative threshold sits at 60 percent of median household income after housing costs, which for a couple with two children works out at roughly 24,600 GBP a year. Fall below that line and the official statistics count you as living in poverty.
Absolute poverty uses a frozen benchmark, adjusted only for inflation, so it answers a different question: are the poorest households better off than they were in 2010? On that measure, progress has flatlined. Around 12 million people fall below the absolute line, and the gap between the two figures narrows whenever median wages stagnate.
A third measure, destitution, tracks people who cannot afford at least two essentials such as heating, shelter or food. Roughly 3.8 million people, including over one million children, experienced destitution in a single year. That figure has more than doubled since 2017 and is the sharpest signal in the entire dataset.
Relative Versus Absolute Low Income
The distinction matters when politicians quote figures. A recession can lower median income, which mechanically drags the relative threshold down and makes relative poverty appear to fall while real hardship rises. Reading both measures side by side is the only honest way to interpret the trend, and it explains why headlines from opposing parties can both be technically accurate.
How Poverty Looks in a Market Town Like Wallingford
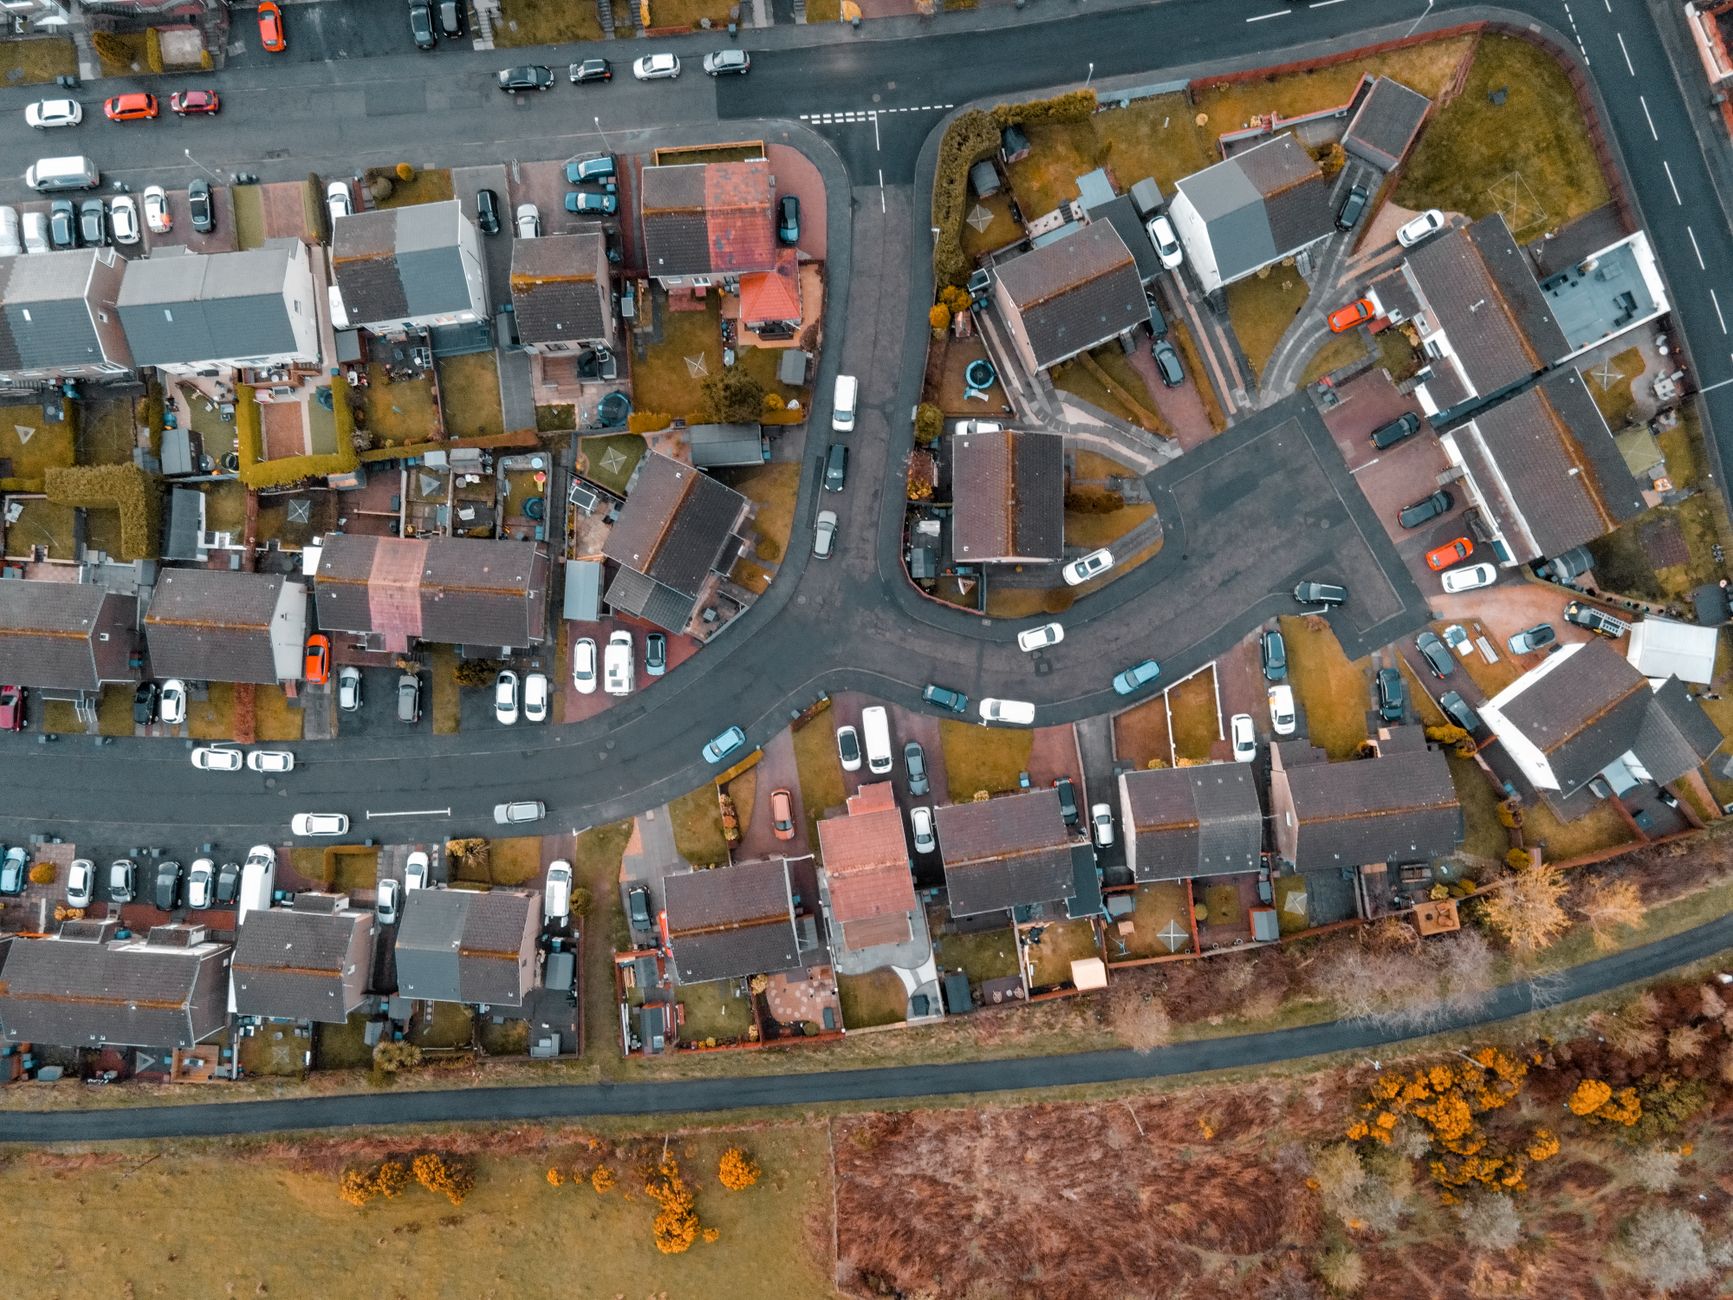
Rural and small-town poverty hides well. There are no visible estates, no obvious clusters of deprivation, and the Georgian frontages on the high street suggest comfort. Yet South Oxfordshire households on low incomes face a transport premium, a heating premium for older housing stock, and childcare costs that routinely exceed 1,100 GBP per child each month.
Car dependency is the quiet driver. A household without a vehicle in a village outside town spends a disproportionate share of income reaching work, a GP or a supermarket. Running even a modest ten-year-old hatchback costs about 2,400 GBP a year once insurance, fuel, tax and maintenance are added together, which is a full month of take-home pay for many.
Housing seals the gap. Private rent for a two-bedroom property locally sits near 1,150 GBP per month, well above the local housing allowance rate. That shortfall must be covered from money that would otherwise buy food, school shoes or a winter coat, which is precisely why after-housing-cost figures tell the truer story.
The Cost of Living Squeeze on Discretionary Spending
Discretionary spending is the first casualty of a tight budget, and pet ownership is one of the clearest barometers. Search demand for a french bulldog puppy for sale exploded during lockdown, when breeders in some regions were asking 3,000 GBP or more. Demand has since cooled sharply, and prices have followed it down.
The typical french bulldog puppy price uk now ranges between 1,200 GBP and 2,200 GBP from a licensed breeder, roughly 40 percent below the 2021 peak. Rescue centres report record intake, with Frenchies and English Bulldogs among the most commonly surrendered breeds. Families who typed puppy for sale french bulldog into a search bar two years ago are now the ones handing dogs back.
The pattern repeats across breeds. Queries such as english bulldog puppy for sale near me and puppy bulldog for sale near me spiked while furlough kept people at home and household savings were unusually high. Once energy bills doubled, the same searches converted at a far lower rate, because a puppy is a fifteen-year financial commitment, not a one-off purchase.

Why Puppy Prices Track the Economy
Pedigree dogs behave like a luxury good with a long tail of running costs. Insurance for a brachycephalic breed averages 60 to 90 GBP a month, and airway surgery can exceed 3,000 GBP. When incomes tighten, listings for a blue french bulldog puppy for sale sit unsold for weeks, while adverts for a mini bulldog puppy for sale drift steadily downward in price.
Household Budgets: A Line-by-Line Comparison
Abstract percentages mean little until they are set against a real monthly budget. The table below compares a household on the relative poverty threshold with one on the regional median, using typical South Oxfordshire costs. The difference is not luxury versus austerity; it is solvency versus a structural monthly deficit.
| Monthly item | Household at poverty line | Household at regional median |
|---|---|---|
| Net income | 2,050 GBP | 3,400 GBP |
| Rent or mortgage | 1,150 GBP | 1,300 GBP |
| Energy and water | 210 GBP | 230 GBP |
| Food and essentials | 520 GBP | 700 GBP |
| Transport | 200 GBP | 320 GBP |
| Remaining for everything else | -30 GBP | 850 GBP |
The bottom row is the one that matters. A household at the threshold has nothing left for a school trip, a boiler repair or a vet bill, which is why the same family that once browsed listings for a puppy french bulldog for sale now relies on a credit union or a buy-now-pay-later plan for a washing machine.
Debt then compounds the problem. Average unsecured debt among low-income households sits near 3,100 GBP, and repayments of 120 GBP a month convert a small deficit into a permanent one. That mechanism, rather than any single price rise, is what keeps the poverty figures stubbornly flat year after year.
Local Support, Advice and Practical Steps
Practical help exists, and take-up is far below entitlement. An estimated 23 billion GBP in benefits goes unclaimed across Britain each year, including Pension Credit, Council Tax Support and Healthy Start vouchers. A single benefits check can lift a household several hundred pounds a month without any change in circumstances.
- Request a free benefits calculation through Citizens Advice before assuming you do not qualify
- Apply for the Household Support Fund through South Oxfordshire District Council for energy and food grants
- Ask your energy supplier about the Warm Home Discount, worth 150 GBP annually
- Check eligibility for free school meals, which also unlocks pupil premium funding for the school
- Speak to a credit union rather than a doorstep lender before borrowing
Community infrastructure carries real weight too. Food clubs, repair cafes, uniform swaps and library warm spaces all reduce the cash cost of living without stigma. These schemes will not change the national uk poverty statistics on their own, but they change the arithmetic for the households that use them.
Anyone already struggling should act early rather than at crisis point. Arrears negotiated in month one are almost always cheaper than arrears escalated to enforcement in month six, and free debt advice from StepChange or National Debtline costs nothing and carries no obligation.
How Are UK Poverty Statistics Collected and Are They Reliable?
The core figures come from the Households Below Average Income series, produced annually by the Department for Work and Pensions using the Family Resources Survey. Around 19,000 households are interviewed in detail about income, benefits, housing costs and material deprivation, and the results are weighted to represent the whole population. The methodology is stable and internationally comparable, which makes year-on-year trends trustworthy. Its weaknesses are known: the survey undercounts the very richest and the very poorest, misses people in temporary accommodation, and publishes with a lag of well over a year. Independent bodies such as the Joseph Rowntree Foundation and the Resolution Foundation reanalyse the same raw data with different assumptions, which is why credible sources sometimes quote figures that differ by several hundred thousand people.
Is Working Full Time Enough to Escape Poverty in the UK?
Not reliably. Roughly 60 percent of people in poverty live in a household where someone works, and around one in eight workers is classed as low paid after housing costs are deducted. The National Living Wage of 12.21 GBP an hour delivers about 23,800 GBP a year for a full-time job, which lifts a single adult clear of the threshold but leaves a single parent with two children below it once childcare and rent are counted. Part-time and insecure hours make the picture worse, because variable shifts create variable income that interacts badly with Universal Credit assessment periods. The practical answer is that full-time work sharply reduces the risk of poverty without eliminating it, and housing cost is the single biggest variable determining which side of the line a working household lands on.
What Do Rising Pet Surrender Rates Tell Us About Household Finances?
Pet surrender is a useful leading indicator because it captures financial stress before it shows in official data. Rescue organisations report intake rises of 25 to 50 percent since 2022, with brachycephalic breeds heavily overrepresented. When searches like french bulldog puppy for sale uk, puppy french bulldog for sale uk, british bulldog puppy for sale near me and american bulldog puppy for sale near me convert at lower rates while rehoming lists lengthen, it signals that households are cutting recurring commitments rather than one-off treats. That distinction matters, because recurring cuts are what people make when they expect the squeeze to last. Vets confirm the same pattern through deferred vaccinations and lapsed insurance. Read alongside the official figures, the pet market offers a fast, honest read on discretionary capacity across British households.
